How Did COMPULIFE Create These Graphs?
Background
The initial History of Term Life Insurance Premiums web page and graphs represents hundreds of hours of work. The premiums for 6 companies, for 3 different level categories, for 5 different health classes, for 60 months, were quoted and individually posted to a spreadsheet. The spreadsheet was then used to average the lowest 6 premiums for that category and class, and the 900 results were then used to produce the graphs. In total the graphs that you see here are the result of 5,400 individual term insurance premiums.
The work to accomplish this task started in 2006 when COMPULIFE began the process of gathering together, in one place, the past monthly editions of the COMPULIFE Quotation System. The complete history spans a period from 1990 to 2007. The original purpose of doing so was to produce a "COMPULIFE Historical CD" which COMPULIFE subscribers could purchase.
COMPULIFE now offers that Historical CD to our subscribers for $99. Click here for more information about the historical CD.
The CD contains the approximately 200 monthly editions. To create this we have gone back and installed copies of past monthly updates unto a single hard drive. Each monthly update was then run and initialized. Each monthly update was then compressed into "zip" files which can be transferred to a single CD. Each CD is created individually, and includes each edition of COMPULIFE from April 1990 up to and including the immediate preceding month of the CD order.
The reason for assembling a CD was to give COMPULIFE subscribers, who wanted a past record of term insurance policies and rates, an easy way to re-install old editions of the COMPULIFE program.
This data is also useful to life insurance companies who want to track past trends in pricing changes.
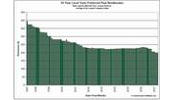
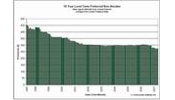
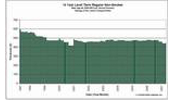
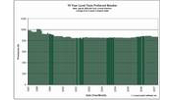
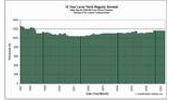
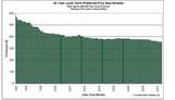
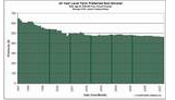
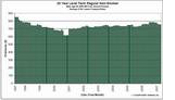
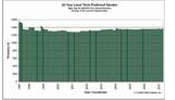
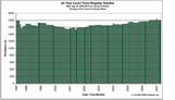
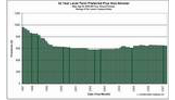
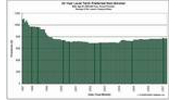
The other reason that COMPULIFE organized this historical CD was that we are frequently asked by the media for both current and historical pricing information. Generally media interest concerns term insurance pricing trends. With that in mind, and with access to the month to month editions of COMPULIFE in a single place, we decided to compile information from those editions and produce a graphic analysis of pricing trends for the past 10 years. The graphs are provided here:
https://www.term4sale.ca/historical-premiums.php
These graphs are COMPULIFE's first step in providing historical analysis on a broad graphical basis. While the first series of graphs took hundreds of hours, the next set will be easier to generate. At this point COMPULIFE will wait and gauge the response and see whether there is further demand for alternative scenarios. We will try to provide additional graphic examples as demand is identified and as time permits. If there is significant commercial demand for this type of graphic analysis, COMPULIFE may spend the money and time to automate the process, which would allow us to include only certain companies or groups of companies.
What Do the Graphs Represent?
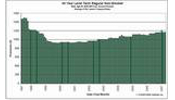
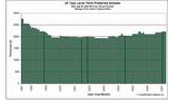
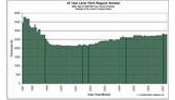
The graphs show the month to month average premiums for the 6 least expensive term policies for 15 different scenarios, over a period of 120 months.
First, there are three basic forms of level term insurance used in the graphs:
10 Year Level Premium Term
20 Year Level Premium Term
30 Year Level Premium Term
NOTE: It is COMPULIFE's view that the most popular term life insurance plan in today's market is 20 level premium year term. We make that assumption based upon the simple fact that there are more 20 year level term products offered by life insurance companies than any other level period. Second in popularity is 30 year level term followed by 10 year level term.
20 year level term was not always the most popular level term. For many years the most popular level term policy sold in the United States was ART (annually renewable term) or YRT (yearly renewable term). Approximately twenty years ago 10 year term emerged into the market and it quickly and successfully competed with the ART/YRT alternatives. Not long after that 20 year term emerged and by 1997, when these graphs begin, 20 year term was becoming equally popular to 10 year term. Ten years ago ART/YRT products were fading fast. In 1997 30 year term was just emerging as a product alternative. Its popularity has grown steadily although it is still not as popular as 20 year term. Part of the reason for that is due to the maximum issue age for 30 year term. The policy is commonly not available to insurance buyers over age 50. Many companies offer 20 year term all the way to age 65. ART/YRT products, while still available in the market, are not as competitive as 10, 20 or 30 year level term and very few ART/YRT products are being purchased.
Second, there are three 5 basic health classes for each of the 3 level term categories. Those classes are "generically" named by COMPULIFE as:
Preferred Plus Non-Smoker
Preferred Non-Smoker
Regular Non-Smoker
Preferred Smoker
Regular Smoker
It is important to realize that many life insurance companies use the same health class nomenclature as COMPULIFE to describe their premiums but many do not.
For example, many companies will use the terms "tobacco" and "non-tobacco" to describe their class breakdown between smokers and non-smokers. Virtually ALL life insurance companies now offer lower rates to non-smokers and higher rates to smokers. A non-smoker is generally considered a person who has not smoked or used tobacco in any form for the preceding 12 months. Preferred health risks frequently require longer periods of non-tobacco use than the 12 months assumed for their non-preferred premiums.
COMPULIFE uses the term "regular" to describe the highest "non-rated", non-preferred premiums offered to prospective insurance risks. Many companies use the word "standard" to describe what COMPULIFE calls regular. Compulife decided that the term "standard" was confusing because a number of companies, at the time, were using the word standard to mean "smoker". Given the potential for confusion, and the importance of smokers NOT accidentally or purposely buying non-smoking products, COMPULIFE elected to use the term "regular".
Further, many companies will refer to their preferred products as "Preferred Non-Tobacco" or "Preferred Smoker", and may simply refer to their regular or standard health classes as "Non-Tobacco" or "Smoker" without using any additional description.
Rated premiums are often offered by life insurance companies when they encounter consumers whose health or lifestyle represents a higher than normal risk. For example, a type 2 diabetic would be considered a much higher health risk than standard and a company will generally offer a rated premium which means the standard or regular rate with an additional "rated" premium cost. COMPULIFE does not compare rated premiums.
A "Preferred" health premium is a lower than the regular or standard premium from the same company. To obtain a preferred rate the insured must demonstrate that they have better than average risk criteria. The most common areas typically examined by life insurance companies are:
Height and Weight
Blood Pressure
Cholesterol
Family Health History
Driving Record
Period of Time a Person has Not Smoked (for non-smokers)
Most companies will set out specific criteria in their literature and a person should know in advance whether they can meet the criteria for the lower premium. Having said that, companies may consider other mitigating factors, for and against, before deciding to provide a preferred premium discount to a consumer. Until the insured actually applies and obtains a decision, there is no absolute certainty what the company's final decision will be.
A "Preferred Plus" health premium is a lower price than the same company's preferred premium. The same criteria referred to above, are also considered in order to obtain the Preferred Plus rate, but the criteria are even more stringent. The vast majority of companies who offer Preferred Plus premiums do NOT offer that class to smokers - the additional class ONLY applies to non-smokers.
In producing these graphs COMPULIFE has relied upon the generic classes it uses to classify a company's premiums. It should be noted that the criteria for Preferred and Preferred Plus classes vary from company to company. For example, one company may have more restrictive height and weight tables than another. To address that COMPULIFE provides our subscribers, and provides consumers at www.term4sale.ca, a "Preferred Health Analyzer". By answering the specific questions the COMPULIFE comparison software can advise whether or not a prospective insurance buyer falls in or out of the published criteria set forth by the company.
NOTE: In preparing these graphs COMPULIFE did not analyze the distinctions between one company's health criteria versus another, for the similar preferred or preferred plus category. It was for that reason, among others, that we determined the best way to examine trends was to look at the "AVERAGE" premiums for the 6 least expensive products.
The age selected for this study is 40. The reason is that families generally will hit their peak need for life insurance at or about this age. Having said that, it is COMPULIFE's view that 10 year level term is a completely inappropriate product for a 40 year old and should only be purchased by a 40 year old who knows with reasonable certainty that their need for insurance will disappear in 10 years. For more information on this subject we would invite you to read COMPULIFE president Bob Barney's article:
Go Long On Term Life Insurance
The face amount selected for this study is $500,000. In times past, when doing analysis for the media, we are frequently asked for smaller face amounts. While 10 years ago a $250,000 face amount might have been more realistic for a 40 year old, the same cannot be said today. Family men, buying term life insurance to protect their families, should think of $500,000 as a modest amount of life insurance to carry. That is particularly true when you consider just how affordable today's premiums for level term life insurance really are.
COMPULIFE president Bob Barney has written extensively on the subject of buying life insurance as a way to replace income that is lost if a breadwinner dies. Here is a link to a list of those published articles on the subject of buying life insurance for income replacement purposes. Those articles, together with a description of COMPULIFE's "Income Replacement Calculator" can be found by clicking here:
Income Replacement Calculator
Rates have been quoted for the state of California. California is the most populous state in the nation and for that reason the most important state for life insurance companies to offer products. Having said that, not all life insurance companies included in COMPULIFE's database are available in California. Quite often companies that sell policies in the state of New York do not offer life insurance outside New York or vica versa. Larger life insurance entities, who do business in New York and outside New York, frequently do so by operating two separate life insurance companies.
Through the years New York's zealous insurance regulatory environment has left its residents with less than the best term life insurance alternatives available in the nation. For many years New Yorkers paid more and got less when buying term life insurance. While the situation has improved, and the products offered in New York are much more comparable, and frequently the same, to those sold outside the state, that was not always the case. There remain differences between New York products and non-New York products. For example, older New Yorkers are not able to buy term policies that are available to people in other states because the maximum issue ages in New York are less than outside New York.
While the current version of COMPULIFE's program quotes from a total of about 125 life insurance companies, the actual number of companies included in results for California will be less given the New York factor.
The number of life insurance companies in the COMPULIFE program has been steadily shrinking during the ten year period we are looking at. Ten years ago, the total number of companies in COMPULIFE was aproximately 160. At one time in Compulife's history, the total number of companies in our U.S. database was just over 190. During the past two decades the life insurance industry has been going through a period of acquisition and amalgamation, resulting in fewer life insurance companies.
Questions that Have been Raised by the Graphs
Question: Do these graphs take into account inflation?
Answer: No these graphs do not take into any account inflation because inflation is irrelevant to the historical comparison of prices. While it is true that a $500,000 term life insurance policy has less "real dollar" value today, than a corresponding $500,000 policy would have had ten years ago, the dollars used to pay the premiums today are correspondingly of less value. This study is not looking at that issue, it is examining the relative premium costs and how they have changed during the past 10 years.


